
 Facebook
 X
X
 Pinterest
 Copy Link
The Gardner Report – Park City – 2020 Second Quarter
The following analysis of select neighborhoods in the Park City real estate market is provided by Windermere Real Estate Chief Economist Matthew Gardner. We hope that this information may assist you in making better-informed real estate decisions. For further information about the housing market in your area, please don’t hesitate to contact your Windermere agent.
ECONOMIC OVERVIEW
COVID-19 had a significant impact on employment in Utah, causing the loss of more than 144,000 jobs in March and April and raising the state’s unemployment rate to 10.4%. For comparison, peak unemployment following the Great Recession was only 8%.
That said, it appears as if Utah’s massive contraction in employment is behind us (at least for now). Employment in the state rose by 40,400 jobs in May, an increase of 2.8% in just one month, allowing the unemployment rate to drop to 8.5%.
Although it is certainly too early to say that we are out of the woods, we seem to be headed in a positive direction. That said, COVID-19 infection rates in Utah started increasing in June and may slow the economic recovery if the direction is not reversed. Regardless, I do not believe that it is likely to have a significant impact on the housing market.
HOME SALES
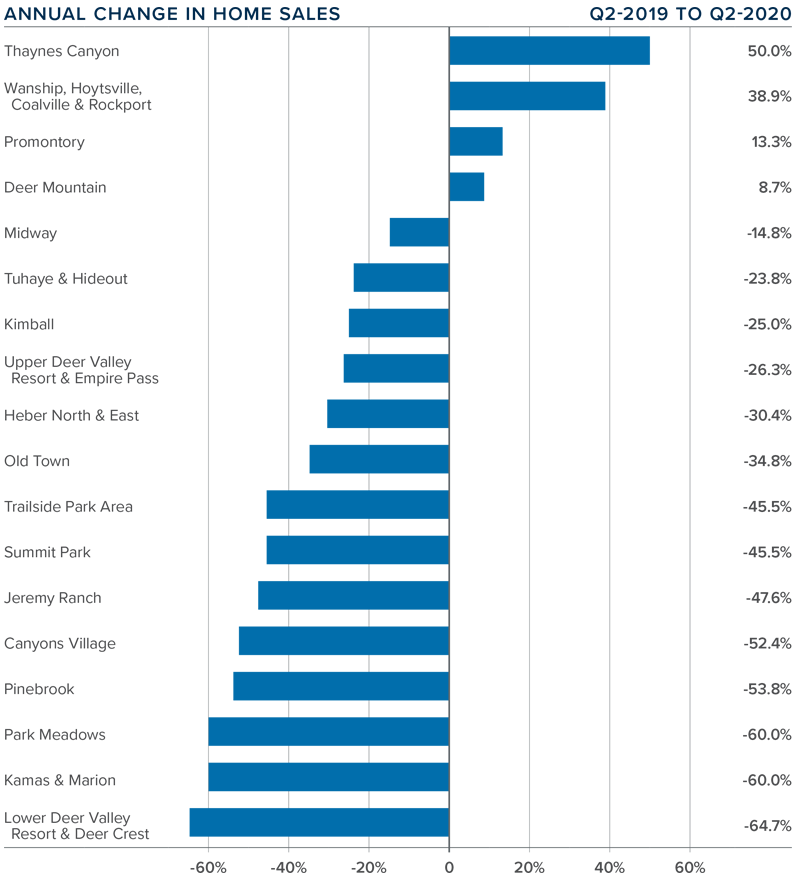
❱ In the second quarter of 2020, 131 homes sold in the Park City area, a drop of 37.3% from the second quarter of 2019, and down 22.9% from the first quarter of this year.
❱ Home sales were a mixed bag, with increases in 4 neighborhoods but declines in 14. The areas that saw sales activity increase are all very small.
❱ The drop in sales came as inventory levels rose more than 300%. The most likely explanation is that concerns over COVID-19 outweighed the additional choice of available homes.
❱ Pending home sales were 15.6% lower than a year ago, but only 3.1% lower than in the first quarter. This makes me hopeful that the market will start to stabilize as we move through the balance of the year.

HOME PRICES
❱ The average home price in the Park City neighborhoods contained in this report rose 1.9% year-over-year to $1.159 million. Sale prices were 0.6% higher than in the first quarter of 2020.
❱ The most affordable neighborhoods in terms of average sale prices were Kimball, Heber North & East, Wanship, Hoytsville, Coalville, and Rockport. The most expensive were Upper Deer Valley Resort & Empire Pass, Promontory, and Thaynes Canyon.
❱ Prices rose in a majority of neighborhoods, with significant gains in the Promontory, Thaynes Canyon, Jeremy Ranch, and Lower Deer Valley Resort & Deer Crest neighborhoods. Annual sale prices dropped in seven markets, with the Canyons Village area experiencing the steepest decline.
❱ The Park City market is relatively small, but with some very expensive real estate. It will be interesting to see if COVID-19-related impacts persist or if we start to see a return to normal activity.

DAYS ON MARKET
❱ The average time it took to sell a home in the Park City area rose three days compared to the second quarter of 2019.
❱ The amount of time it took to sell a home dropped in nine market areas and rose in nine compared to a year ago.
❱ In the second quarter of this year, it took an average of 101 days to sell a home. Homes sold fastest in Summit Park and slowest in the Canyons Village neighborhood.
❱ The greatest drop in market time was in the Tuhaye/Hideout neighborhood, where it took 91 fewer days to sell a home than during the same period a year ago.

CONCLUSIONS
 This speedometer reflects the state of the region’s real estate market using housing inventory, price gains, home sales, interest rates, and larger economic factors.
Clearly, the Park City housing market was still reacting to the influences of COVID-19 during the second quarter. I see demand, but the pandemic is still making the direction of housing uncertain. That said, I remain hopeful that we will start to get some clarity as we move through the balance of the year. Assuming the state gets new infection rates back under control, I can see the market start to perform at its potential in the second half of the year. As such, I am leaving the needle in the same position as last quarter.
ABOUT MATTHEW GARDNER
 As Chief Economist for Windermere Real Estate, Matthew Gardner is responsible for analyzing and interpreting economic data and its impact on the real estate market on both a local and national level. Matthew has over 30 years of professional experience both in the U.S. and U.K.
In addition to his day-to-day responsibilities, Matthew sits on the Washington State Governors Council of Economic Advisors; chairs the Board of Trustees at the Washington Center for Real Estate Research at the University of Washington; and is an Advisory Board Member at the Runstad Center for Real Estate Studies at the University of Washington where he also lectures in real estate economics.
Originally posted in Park City Real Estate Market Update by Matthew Gardner, Chief Economist, Windermere Real Estate
The Gardner Report – Utah – 2020 First Quarter
The following analysis of select counties of the Utah real estate market is provided by Windermere Real Estate Chief Economist Matthew Gardner. We hope that this information may assist you with making better-informed real estate decisions. For further information about the housing market in your area, please don’t hesitate to contact me.
A MESSAGE FROM MATTHEW GARDNER
Needless to say, any discussion about the U.S. economy, state economy, or housing markets in the first quarter of this year is almost meaningless given events surrounding the COVID-19 virus.
Although you will see below data regarding housing activity in the region, many markets came close to halting transactions in March and many remain in some level of paralysis. As such, drawing conclusions from the data is almost a futile effort. I would say, though, it is my belief that the national and state housing markets were in good shape before the virus hit and will be in good shape again, once we come out on the other side. In a similar fashion, I anticipate the national and regional economies will start to thaw, and that many of the jobs lost will return with relative speed. Of course, all of these statements are wholly dependent on the country seeing a peak in new infections in the relatively near future. I stand by my contention that the housing market will survive the current economic crisis and it is likely we will resume a more normalized pattern of home sales in the second half of the year.
HOME SALES
- In the first quarter of 2020, 6,996 homes sold, which was a solid 5.1% increase compared to the same period in 2019. Sales were down 20.2% compared to the fourth quarter of 2019.
- Total sales activity rose in all counties covered by this report. Year-over-year sales rose by double digits in three counties, with impressive increases in the relatively small Wasatch County.
- The number of homes for sale in the first quarter was down by 24.2% compared to the same period a year ago and was 27.2% lower than the fourth quarter of 2019. Clearly COVID-19 has had an impact on prospective home sellers.
- Pending sales in the first quarter were up 2.6% compared to the fourth quarter of 2019, suggesting that buyers are still in the market even though listing inventories are very tight.

HOME PRICES
- The average home price in the region continued to rise in the first quarter, with a year-over-year increase of 10.4% to an average of $404,316. Prices were a modest 0.3% higher than in the fourth quarter of 2019.
- All counties contained in this report saw price increases compared to the same period a year ago.
- Appreciation was strongest in Wasatch County where prices were up 37.9%. However, this is a small area and can be subject to significant swings in sale prices.
- The takeaway here is that home prices continued to appreciate at considerable rates during the quarter. The big question will be whether this continues as we move through the economic slowdown created by COVID-19.

DAYS ON MARKET
- The average number of days it took to sell a home in the counties covered by this report dropped five days compared to the first quarter of 2019.
- During the first quarter of the year, it took an average of 59 days to sell a home in the region, up by 2 days when compared to the fourth quarter of 2019.
- Homes sold fastest in Davis and Salt Lake counties, and slowest in Summit and Wasatch counties. That said, it took 23 fewer days to sell a home in Summit County than it did a year ago.
- Market demand appeared to remain quite robust during the first quarter of this year.

CONCLUSIONS

This speedometer reflects the state of the region’s real estate market using housing inventory, price gains, home sales, interest rates, and larger economic factors.
Given the current economic environment, I have decided to freeze the needle in place until we see
a restart in the economy. Once we have resumed “normal” economic activity, there will be a period of adjustment with regard to housing. Therefore, it is appropriate to wait until later in the year to offer my opinions about any quantitative impact the pandemic will have on the housing market.
ABOUT MATTHEW GARDNER
 As Chief Economist for Windermere Real Estate, Matthew Gardner is responsible for analyzing and interpreting economic data and its impact on the real estate market on both a local and national level. Matthew has over 30 years of professional experience both in the U.S. and U.K.
In addition to his day-to-day responsibilities, Matthew sits on the Washington State Governors Council of Economic Advisors; chairs the Board of Trustees at the Washington Center for Real Estate Research at the University of Washington; and is an Advisory Board Member at the Runstad Center for Real Estate Studies at the University of Washington where he also lectures in real estate economics.
